

Trends for the 2019 Proxy Season
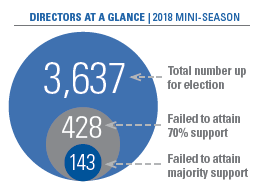 Shareholder voting during 1,024 meetings held during the “mini-season” between July 1 and Dec. 31, 2018 provides a window into what's in store for the 2019 proxy season. A total of 3,637 directors stood for election this past season — 143 of them failed to receive majority support and 428 directors failed to attain at least 70% support, a threshold monitored by some proxy advisors.
Source: ProxyPulse, Broadridge and PwC
The Board's Sustainability Responsibility
 There is little unanimity at the board level when it comes to where the buck stops for environmental sustainability. Less than half of directors surveyed said environmental and sustainability issues are formally overseen at the board level. More specifically, 20% of respondents reported that their full board has a formal mandate covering environmental and sustainability issues, and 30% reported that a board committee is responsible for it.
Source: Diligent Institute: “Winds of Change: Environmental Sustainability Rises to the Board Level”
Long-term Incentives a Bigger Part of CEO Paychecks
Short- and long-term incentives grew by 7.5% in 2018, with long-term incentive (LTI) use reflecting the trend toward more performance shares and fewer stock options. Some other key findings:
• Median LTI values granted to CEOs in 2018 were just over $8.4 million, reflecting a 7.5% median increase over the prior year.
• Shares with vesting tied to performance metrics continue to be the most utilized LTI vehicle among the S&P 500 with prevalence increasing to 92% of the sample in 2018 compared to 84% in 2014.
• Over the same period, the prevalence of shares that vest solely based on service has increased to 62% from 54%, while stock option usage has declined to 58% from 66%. Long-term Incentives a Bigger Part of CEO Paychecks
Source: Mercer, CEO Pay Analysis of S&P 500 Early Proxy Filers
Company Success Not a Factor in CEO Pay Ratio
 Advocates of the CEO pay ratio disclosure seem to be of the mindset that the ratio correlates with company performance. However, one study finds no such correlation. In fact, the lowest average three-year total shareholder return (TSR) was associated with the lowest pay ratio
band. While the highest average three-year TSR correlated with the band of ratios between 35 and 74, it dropped off as the ratio increased.
Source: Pearl Meyer, “The CEO Pay Ratio: Data and Perspectives from the 2018 Proxy Season”